Portrait of a Food Pantry Visitor:

Data, Demographics, and disparities

This report aims to highlight current disparities among food pantry visitors related to race and ethnicity, gender, and age. It is our hope that this report will inform the public and policymakers about these disparities, why they exist, and potential ways we can remedy them in our community, as it is critical to understand the ways in which previous inequitable policies influence, and often negatively impact, people’s current realities today.

Letter from the CEO

Thank you for your interest in a better understanding of those who visited our Food Pantry Network over this past fiscal year. This is the third year that DMARC has released this report and each year has brought its own insights and challenges. Our goal in releasing this data has and always will be to turn the data-driven insights we collect into community-wide action.

This report is a tool we utilize to address the root causes of poverty, so many of which remain remarkably consistent from year to year. Despite historic levels of visitors seeking out a food pantry during this time, you will find the demographics and disparities that we’ve identified around food insecurity are not often drastically different from year to year, just more pronounced. While we have a long way to go, there are real and actionable steps we can be taking today to address these disparities.

With this report, we hope to collaborate with other nonprofit organizations where there is shared mission and goal. We hope to create road maps that address barriers to receiving assistance in a different and more targeted way. We hope to improve our own services and shed light on the bad faith arguments we hear so often that aren’t based in fact. And most importantly, we hope to show the community the situations those in need of food assistance are really facing, with real data that we can back up with personal stories from many of those with and for whom we work.

If, in reading this, you see something that sparks your interest or inspires an idea…. let’s talk! Hopefully, in a year from now, we can look back on progress we made together after taking action today.

Matt Unger

CEO | DMARC

CONTACT US

KEY FINDINGS


  • More than One in three households assisted used the DMARC Food Pantry Network for the first time ever.

    From July 1, 2021 to June 30, 2022, almost 1 in 3 individuals utilizing the DMARC Food Pantry Network was a first-time food pantry visitor. While the number of people receiving food assistance continues to reach record levels, many of the demographic disparities observed previously remain consistent or are more pronounced with the increased need. The average household size for new individuals increased by 9 percent and is driven by an increase in new individuals that identify as Asian/Native Hawaiian/Pacific Islanders, Black/African Americans, Other/Unknown - Hispanic, Other/Unknown - Non-Hispanic, White - Hispanic, and White - Non-Hispanic pantry visitors. WHY? The biggest contributing factor for the increase in new individuals was the record level of inflation experienced across almost every industry in 2022. For many first time visitors, a reduction in benefits coupled with the rise of prices at the grocery store, gas station, rent, and other cost of living expenses meant seeking out additional support for food assistance.

  • Racial disparities among food pantry visitors exist in all communities across Greater Des Moines, but are especially pronounced in suburban communities.

    In some cities, certain racial groups are more than ten times as likely to use a food pantry compared with the general population. This points to significantly different financial realities between White - Not Hispanic people and people of color within suburban communities. Much of this reality can be traced back decades. Redlining policies of the 1930’s shaped our neighborhoods and prevented people who were not white from building wealth through homeownership. The same neighborhoods that were disengaged through racist policies nearly 100 years ago are still some of the areas of greatest need today. However, some disparities are more pronounced today based on new barriers to access. For example, Hispanic people are less likely to receive disability benefits, social security, and SNAP. This can likely be attributed to documentation status limiting program eligibility and fear of repercussions for using programs even when eligible. This also highlights the higher level of need for non-governmental resources for Hispanic people in our community.

  • Gender disparities exist across all races and ethnicities.

    Across nearly every category, women are more likely to use a food pantry than men. There is no gender disparity among children. The level of disparity increases with age, from a gap of 5 percentage points among young adults to a 16 point gap among seniors. This points to financial disparities between men and women, and suggests a greater reluctance for asking for help from men.

  • Average household size and average number of visits have increase

    The average household size being assisted by the DMARC Food pantry network increased from 2.34 to 2.43 individuals this fiscal year. This points to an increase of young adults and seniors living with family members as the cost of living and rent in the DSM metro outgrew wages and income in 2022.

  • Just under half of all pantry visitors use a food pantry once or twice a year.

    The average food pantry visitor uses a food pantry 3.9 times in a year - an increase from last fiscal year. Only 4% of everyone who used a food pantry did so for all twelve months of fiscal year 2023. This points to the fact that most people use a food pantry only as a last resort when other options are not available.

  • Seniors and people who identify as Asian, Native Hawaiian, or Pacific Islander use food pantries at a higher frequency than others.

    While the average food pantry visitor used a food pantry 3.9 times a year, seniors visited food pantries 5.1 times a year on average, and people who identify as Asian, Native Hawaiian, or Pacific Islander visited food pantries 5.4 times a year on average. Asian seniors visited an average of 6.6 times a year.

  • The level of child poverty has increased and so has the percentage of children being assisted by DMARC

    The child poverty rate in the United States more than doubled between 2021 and 2022, according to data from the U.S. Census Bureau. WHY? A critical factor in this was the expiration of the pandemic-era expansion of the child tax credits. Just a year after the rate hit a historic low of 5.2 percent, the percentage of children living in poverty jumped to 12.4 percent in 2022 after congress allowed the policy to sunset. A key difference in how the policy operated previously was making the tax credit refundable, allowing millions of low income families to qualify who didn’t make enough to owe income tax. This year’s report shows that child poverty affects some demographic groups more than others. More than one in three of all people assisted were children (0-17 years old) but for white - Not Hispanic people, less than one in four assisted were children. 68.5 percent of those who identified as Multi-Race - Non-Hispanic were children, which is especially important as our communities are becoming more racially diverse.

Demographics and disparities

Below is a summary of basic demographic data that is outlined in the report. to see a breakdown of demographics by age, gender, education, income, and more read the complete online report.

Read the full report online here


Living with the 'new normal'

Despite historic levels of visitors seeking out a food pantry during this time, you will find the demographics and disparities that we’ve identified around food insecurity are not often drastically different from year to year, just more pronounced.
blockimage
Sections

  • State of Play

    Late March 2022 – DMARC moves into larger warehouse and headquarters. New space streamlines operations, expands storage capacity, and enhances the networks purchasing ability.

    April 2022 – Maximum allotments for the Supplemental Nutrition Assistance Program (SNAP; formerly food Stamps). Iowa households receiving SNAP see their benefits drop by an average of $200 a month.

    June 2022 – US inflation rate peaks at 9.1 percent – the highest level in four decades.

    Sept. 2022 – DMARC-Ket Southside Food Pantry opens becoming first brick-and-mortar food pantry staffed and operated by DMARC.

    February 2023 – New partnership agreement with the Food Bank of Iowa introduces changes to how DMARC distributes food to pantry visitors. Repeat visits begin to grow.

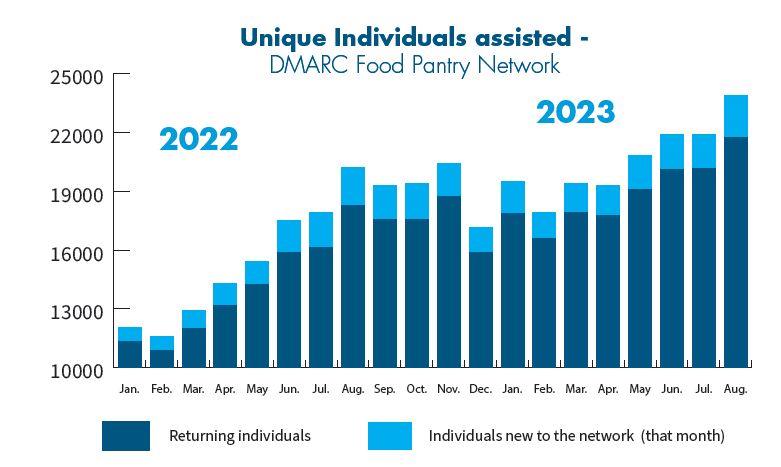
    June 2023 – 2nd busiest month in the history of the DMARC Food Pantry Network – 21,927 unique individuals assisted.

    June 2023 – SF494 is signed into Iowa law. The legislation will add additional restrictions to accessing SNAP like asset testing and create additional hurdles to enrolling in the program.

    August 2023 – 23,886 unique individuals were assisted during the busiest month on record. Shortly after, Sept. 5 becomes the all-time busiest day on record assisting 1,991 unique individuals.

  • Executive Summary

    The Des Moines Area Religious Council (DMARC) Food Pantry Network consists of 14 partner food pantries, multiple mobile food pantry locations, and a no-contact home delivery service. The DMARC Food Pantry Network operates a shared intake system and database. Food pantry visitors are asked a series of 12-14 questions about their household to help us understand the specific needs of our community.

    We are often asked what a “typical” visitor to a food pantry looks like. In truth, We assist people of all races, genders, ages, incomes, and educational attainment. While the number of individuals we are assisting now continues to grow, the answer to this questions remains largely the same. But if we look at the most common responses to the intake questions, we can say the most likely person to visit a food pantry is:

    A White – Not Hispanic woman who graduated high school, has one child, is living below the poverty line, does not receive SNAP benefits, is in and out of employment, and only visits a food pantry once per year.

    While half of everyone assisted by the DMARC Food Pantry Network is White – Not Hispanic, you will see that stark racial disparities exist in every part of our community. These inequities are not unintentional, but are by design as specific federal, state and local policies were created to advantage and disadvantage various populations in our society. As the DMARC Food Pantry Network saw a 27 percent increase in the number of individuals assisted, many of the trends seen in previous reports remained and expanded – With a huge increase in the number of individuals utilizing a DMARC Food Pantry for the first time.

    Previous versions of this report have focused on providing an in-depth breakdown of examined racial disparities through the lense of each demographic and racial group.  All the data used in this report is from DMARC’s fiscal year 2023 (July 1, 2022 – June 30, 2023) where our food pantry network saw a record level of individuals assisted. While most of the disparities examined in previous reports remain consistent with the previous report, this version aims to break down and highlight those observed disparities with a tighter focus on the greatest areas of need that remained consistent – even as the numbers of pantry visitors hit record levels.

    It is our hope that with this version of the report we will inform the public and policy makers about these disparities, why they exist, and potential ways we can remedy them in our community, as it is critical to understand the ways in which previous inequitable policies influence, and often negatively impact, people’s current realities today. If while reading this you are inspired to want to take action, please do not hesitate to reach out about partnering on finding solutions.

  • Areas of opportunity


    We envision a community where everyone has access to the food they want and need at all times. As we look back at the past three years, there are many areas where this vision seemed more attainable than ever before. When people have access to nutritious food, it has a ripple effect on other areas of their life including education, employment, safety and wellbeing, physical and mental health, and so much more.

    We can make this vision a reality when our leaders make intentional policy decisions and our community works together on solutions to remove barriers to people accessing their essential needs.

    This report suggests a number of areas of opportunity for DMARC to begin addressing these disparities, including, but not limited to:

    Policy Advocacy:

    Increasing access to SNAP benefits and SNAP benefit amounts

    Eliminating barriers to federal assistance for certain groups including advocating for the expanded child tax credit, P-EBT, and other low barrier assistance that alleviate child poverty

    Increasing disability and social security benefit amounts

    Requiring “minority impact statements” on proposed pieces of legislation

    Partnerships and Outreach:

    Promoting High School Equivalency Degree (HSED) programs for adults

    Providing additional outreach about SNAP and assistance with applying, especially targeted to seniors and those who are most susceptible to disenrollment in response to state and federal changes to SNAP Referrals to job training and placement programs

    Our Services:

    Expanding food selections at food pantries to address the wants and needs of a diverse set of food pantry visitors

    Targeting outreach to Hispanic communities to build trust and correct misconceptions

    Further Research:

    Conducting a deeper dive to better understand barriers people are facing that are leading to disparities, such as conducting an annual survey to ask questions that are not included in the standard intake process

    Collaborating with other community groups and organizations who work with and for groups facing the largest disparities to better understand why these disparities exist and how we can work together to improve, and eventually, eliminate them