Portrait of a Food Pantry Visitor: Data, Demographics, and Disparities
Today, DMARC is releasing a new report, Portrait of a Food Pantry Visitor: Data, Demographics, and Disparities. This report aims to highlight current disparities among food pantry visitors related to race and ethnicity, gender, and age. It is our hope that this report will inform the public and policy makers about these disparities, why they exist, and potential ways we can remedy them in our community, as it is critical to understand the ways in which previous inequitable policies influence, and often negatively impact, people’s current realities today.
Executive Summary
The Des Moines Area Religious Council (DMARC) Food Pantry Network consists of 14 partner food pantries, 20+ mobile food pantry locations, and a no-contact home delivery service. The DMARC Food Pantry Network operates a shared intake system and database. Food pantry visitors are asked a series of 12-14 questions about their household to help us understand the specific needs of our community.
We are often asked what a “typical” visitor to a food pantry looks like. In truth, there is no such thing as a “typical” food pantry visitor. We assist people of all races, genders, ages, incomes, and educational attainment. But if we look at the most common responses to the intake questions, we can say the most likely person to visit a food pantry is:
A White – Not Hispanic woman who graduated high school, has one child, is living below the poverty line, does not receive SNAP benefits, is in and out of employment, and only visits a food pantry once per year.
While half of everyone assisted by the DMARC Food Pantry Network is White – Not Hispanic, you will see that stark racial disparities exist in every part of our community. These inequities are not unintentional, but are by design as specific federal, state and local policies were created to advantage and disadvantage various populations in our society. For example, one such policy is “redlining” which created inequitable mortgage lending between White and Black communities in our country, including Des Moines, which limited home ownership and multi-generational wealth development in the Black community.
Our first racial disparities report in 2020 examined racial disparities by geographic areas. In this next installment, we expanded the scope of the examined disparities to include gender, age, SNAP participation, income and source of income, frequency of visits, first-time visitors, veteran status, and educational attainment. All the data used in this report is from DMARC’s fiscal year 2022 (July 1, 2021 – June 30, 2022).
It is our hope that this report will inform the public and policy makers about these disparities, why they exist, and potential ways we can remedy them in our community, as it is critical to understand the ways in which previous inequitable policies influence, and often negatively impact, people’s current realities today.
Key Findings
Racial disparities among food pantry visitors exist in all communities across Greater Des Moines, but are especially pronounced in suburban communities. In some cities, certain racial groups are more than ten times as likely to use a food pantry compared with the general population. This points to significantly different financial realities between White – Not Hispanic people and people of color within suburban communities.
Children assisted by the DMARC Food Pantry Network are more racially diverse, and seniors are much more likely to be White – Not Hispanic. One in three of all people assisted were children, and one in ten were seniors. For White – Not Hispanic people, less than one in four assisted were children while one in seven were seniors. This points to how our communities are becoming more racially diverse.
Gender disparities exist across all races and ethnicities. Across nearly every category, women are more likely to use a food pantry than men. There is no gender disparity among children. The level of disparity increases with age, from a gap of 5 percentage points among young adults to a 16 point gap among seniors. This points to financial disparities between men and women, and suggests a greater reluctance for asking for help from men.
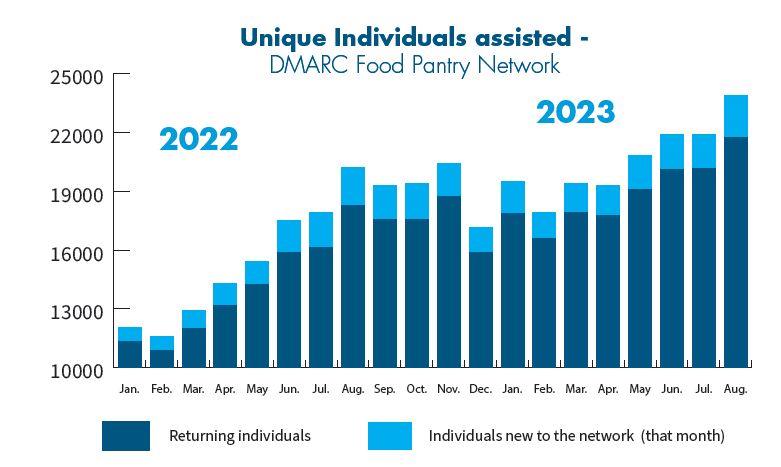
One in three households assisted used the DMARC Food Pantry Network for the first time ever. Households that were first-time food pantry visitors were smaller on average. One in four individuals was a first-time food pantry visitor. This points to the high level of need in our community right now, with many people turning to a food pantry for the first time ever.
Nearly 3 out of 4 food pantry visitors live below the federal poverty line. White – Not Hispanic people who used a food pantry had higher incomes compared to other racial groups. This, too, illustrates the different financial realities between White – Not Hispanic people and people of color in Greater Des Moines.
Hispanic people are less likely to receive disability benefits, social security, and SNAP. This can likely be attributed to documentation status limiting program eligibility and fear of repercussions for using programs even when eligible, such as the 2020 “Public Charge” rule. This also highlights the higher level of need for non-governmental resources for Hispanic people in our community.
More than half of all pantry visitors use a food pantry just once or twice a year. The average food pantry visitor uses a food pantry 3.6 times in a year. Only 4% of everyone who used a food pantry did so for all twelve months of fiscal year 2022. This points to the fact that most people use a food pantry only as a last resort when other options are not available.
Seniors and people who identify as Asian, Native Hawaiian, or Pacific Islander use food pantries at a higher frequency than others. While the average food pantry visitor used a food pantry 3.6 times a year, seniors visited food pantries 5.1 times a year on average, and people who identify as Asian, Native Hawaiian, or Pacific Islander visited food pantries 5.0 times a year on average. Asian seniors visited an average of 6.9 times a year. Among adult visitors who identify as Asian, Native Hawaiian, or Pacific Islander, this average is being driven by people who are employed or act as a stay at home parent or caregiver, who use food pantries at a higher rate than others.
Racist housing policies of the past have lasting impacts to this day. Redlining policies of the 1930’s shaped our neighborhoods and prevented people who were not white from building wealth through homeownership. The same neighborhoods that were redlined nearly 100 years ago are still some of the areas of greatest need today. This points to the lasting impact long-held racist policies of the past still hold today and a need to do more to change those impacts and create equity across our community.
Areas of Opportunity
We envision a community where everyone has access to the food they want and need at all times. When people have access to nutritious food, it has a ripple effect on other areas of their life including education, employment, safety and wellbeing, physical and mental health, and so much more.
We can make this vision a reality when our leaders make intentional policy decisions and our community works together on solutions to remove barriers to people accessing their essential needs.
This report suggests a number of areas of opportunity for DMARC to begin addressing these disparities, including, but not limited to:
Policy Advocacy:
- Increasing access to SNAP benefits and SNAP benefit amounts
- Eliminating barriers to federal assistance for certain groups
- Increasing disability and social security benefit amounts
- Requiring “minority impact statements” on proposed pieces of legislation
Partnerships and Outreach:
- Promoting High School Equivalency Degree (HSED) programs for adults
- Providing additional outreach about SNAP and assistance with applying, especially targeted to seniors
- Referrals to job training and placement programs
Our Services:
- Expanding food selections at food pantries to address the wants and needs of a diverse set of food pantry visitors
- Targeting outreach to Hispanic communities to build trust and correct misperceptions
Further Research:
- Conducting a deeper dive to better understand barriers people are facing that are leading to disparities, such as conducting an annual survey to ask questions that are not included in the standard intake process
- Collaborating with other community groups and organizations who work with and for groups facing the largest disparities to better understand why these disparities exist and how we can work together to improve, and eventually, eliminate them
Got something to say?